Kazuo Misue presented the paper "Area-adaptive Drawing of Rooted Trees" at PacificVis 2024. (April 23-26, 2024)
Ryoto Doi presented the paper "Modeling Human Recognition of Deformed Maps" at Information Visualisation 2023. (July 26-28, 2023)
Ryoto Doi received the Student Encouragement Award at the HCI203 (May 24, 2023)
Sumika Sakurai presented the paper "Investigation of Audio Graph Performance by Combining Auditory Channels" at the HCI203 (March 6, 2023)
Onuki presented the papers "海鳥の行動分析作業の支援を目的とした可視化ツールの開発" at 第15回データ工学と情報マネジメントに関するフォーラム(第21回日本データベース学会年次大会 (March.5.2023)
Misue gave a keynote lecture titled "Graph Drawing for Thinking Support" at Graph Drawing and Network Visualization 2022(2022.9.13-16 at Tokyo Institute of Technology).(September,16,2022)
Misue published the papers "Improved Scheduling of Morphing Edge Drawing" at Graph Drawing and Network Visualization 2022(2022.9.13-16 at Tokyo Institute of Technology).(September,14,2022)
Onuki presented the papers "Visualization tool for comparative analysis of seabird movement data" at Information Visualisation 2023 (July.19.2022)
Ruka Suzuki presented the paper "Investigation of Mental Image Preservation Conditions in Simplification" at the HCI200 (November 1, 2022)
Minami Fujinuma presented the paper "Study on Representations that Assist Reading in Partial Edge Drawing of Graphs" at the HCI200 (November 1, 2022)
Kazuo Misue presented the paper "Development of Automatic Drawing Method for Compound Undirected Graphs" at the HCI197 (March 16, 2022)
Onuki received Student Encouragement Award.(February.14.2022)
Onuki presented the papers "海鳥の移動データの比較分析のための可視化ツールの開発" at HCI196.(January.11.2022)
Misue presented the papers "輪郭線のデフォルメにおけるメンタルイメージの保存条件" at HCI195.(November.30.2021)
Miura presented the papers "海鳥の行動パターンと移動軌跡の視覚的な表現の設計".(December.01.2021)
A team including Hori submitted their work "ブロックチェーンを利用した鍵開閉システム" and received an Awarad of excellence at みんなのラズパイコンテスト.(November.23.2021)
Misue published a book on information visualization(三末和男, 情報可視化入門, 森北出版株式会社)based on the course materials of his lecture.(May.31.2021)
Misue presented the papers "Event-based Viewing Tool for Learning Illustrations" and "Development of a Tool to Help Understand Color Spaces and Color Differences" at Information Visualisation 2020.(September.11.2020)
Misue published the papers "Gradation creation tool for quantitative data expression considering color difference" at HCI189.(September,08,2020)
Misue published the papers "Development of making browsing tool for creator support" at HCI199.(June,02,2020)
Yamagata published the papers "Development and Evaluation of Morphing Method for Preserving Mental Models of Graphs" at HCI187.(presented at May,02,2020)
Misue published the papers "Development of tools to aid in the understanding of the color space and color difference".(presented at September,08,2020)
Misue published the papers "Graph Drawing with Morphing Patial Edges" at Graph Drawing and Network Visualization 2019.(September,19,2019)
Misue published the papers "Evaluation of Representation Fidelity to Similarity in ChronoView" at Information Visualisation 2019@Adelaide.(July,07,2019)
Misue published the papers "Evaluaion of Effectiveness of Glyphs to Enhance ChronoView" at Information Visualization 2019@Paris.(July,03,2019)
Anzai, Ishii & Fukaya published papers at Information Visualization 2018(July,11,2018)
Arai published a paper at GN104(March,19,2018)
Ishii & Fukaya published papers at HCI177(March,16,2018)
Anzai & Mitsui published papers at Interaction 2018(March,5,2018)
Open House will be held in 2015/8/2(Sat).
We also introduce the laboratory.
Misue and Hamada presented the paper in the 19th International Conference on Information Visualisation.
Major Exhibition will be held in 2015/6/6(Sat).
VisLab also performs a poster.
OpenHouse2022's info is now available on OPENHOUSE.
OpenHouse2021's info is now available on OPENHOUSE.
OpenHouse2020's info is now available.
OpenHouse2019's info is now available.
OpenHouse2019's info will be published by September.
OpenHouse2018's info is now available.
OpenHouse2018's info will be published by September.
Facebook page is now available.
VisLab's web pages have been updated.
Visualization and Interactive Systems Laboratory has been established.
In order to effectively utilize the vast amounts of data, it is necessary to understand the data. There are various means to understand the data, but as it is said to be a picture is worth a thousand words, visualization is one of the effective means. In our laboratory, information visualization is a central research topics. We are working on design of visual representation of information, development of techniques to draw visual representation, application of visualization techniques, and investigation of the human visual characteristics.

Information visualization has no restrictions on arrangement and shape of representation. Our task is to design visual representations with functionality and aesthetics according to the purposes of visualization. We are challenging to design of effective representations for multivariate data, time-series data, geographic data, and compound data of them.
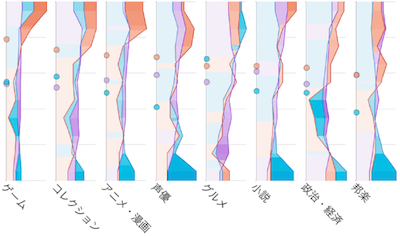
This figure shows a representation to help comparison between two or more sets with multivariate data.

Some visual representations cannot be drawn well by naive methods. So, developing efficient algorithms to draw visual representations is also an important task. We are trying to develop algorithms to obtain aesthetically pleasing layout of a network, to draw readable charts for large amount of data, and so on.
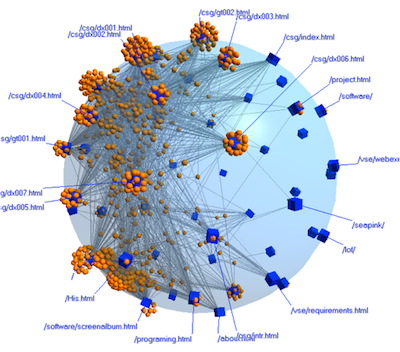
This figure shows a sphere anchored map for network drawing; some nodes are restricted on a sphere to make the network readable.

As applications of visualization techniques, we are working on a variety of system development: a visual information tool with network drawing algorithms, a visual analysis tool with statistical methods, and an intellectual work environment with the augmented reality (AR) technique.
This figure shows that we are trying a visual analysis environment by lab members.

What kinds of representations are conspicuous? What kinds of representations are suitable to express values precisely? Consideration from viewpoints of readers is important to design a visual representations. It is important for such the consideration to understand human visual characteristics. However, there are many unknown part for visual characteristics, and also the way to examine is not well established. Therefore, we are accumulating knowledge about visual characteristics by performing various experiments while designing the experimental methods.